How to Deploy and Setup HoneyDrop Honeypot in AWS

Estimated Deployment Time
10 Minutes
What
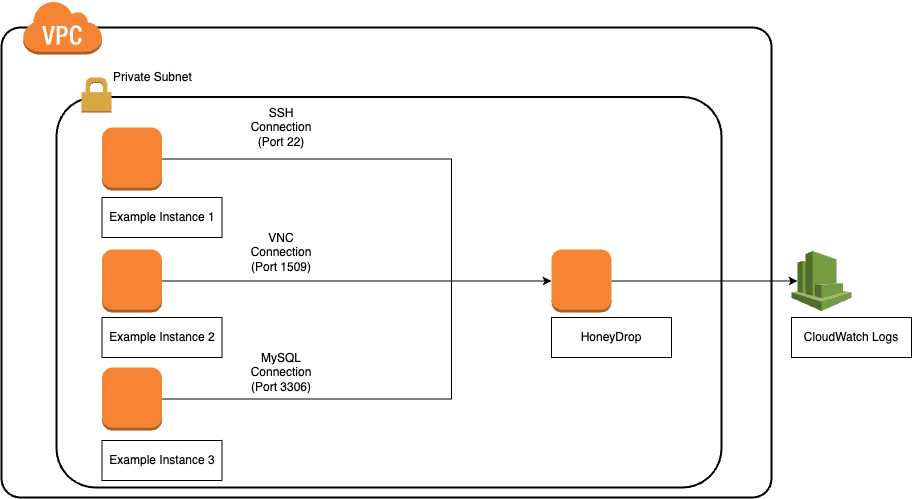
The HoneyDrop appliance is a low-interaction honeypot meant to be deployed in subnets where critical visibility of malicious activities is needed. The HoneyDrop can be configured to emulate:
- Windows SQL servers
- Windows web servers
- Linux MySQL servers
- Linux web servers
When the HoneyDrop appliance is interacted with, logs are generated and sent to AWS CloudWatch within seconds for alerting. These alerts can trigger SNS notifications to send emails, SMS messages or launch Lambda functions.
Why
- Gain visibility into your AWS VPS network environments.
- Enhance security posture without needing to install agents on instances.
- Lure attackers away from high value systems long enough to be identified.
- Enable automated incident response actions to isolate and quarantine compromised hosts.
How
The following steps will explain how to setup and deploy the HoneyDrop appliance.
- Deploy the HoneyDrop appliance from the AWS marketplace into your target subnet. Termilus recommends a t3.medium instance size for optimal operation. Note that once the appliance is deployed, the administrative SSH service takes a minute to become active.
- Navigate to https://console.aws.amazon.com/iamv2/home#/roles and click on "Create role".
- Set the trusted entity type to "AWS service" and the use case to "EC2", now click next.
- Attach the "CloudWatchAgentServerPolicy" and click next.
- Optionally add your keys and click next.
- Name the role "HoneyDropRole" and click "Create role".
- Navigate back to EC2, https://console.aws.amazon.com/ec2/v2/home#Instances:instanceState=running
- Right-click on the HoneyDrop appliance, under "Security" click "Modify IAM role"
- Select the HoneyDropRole and click "Save".
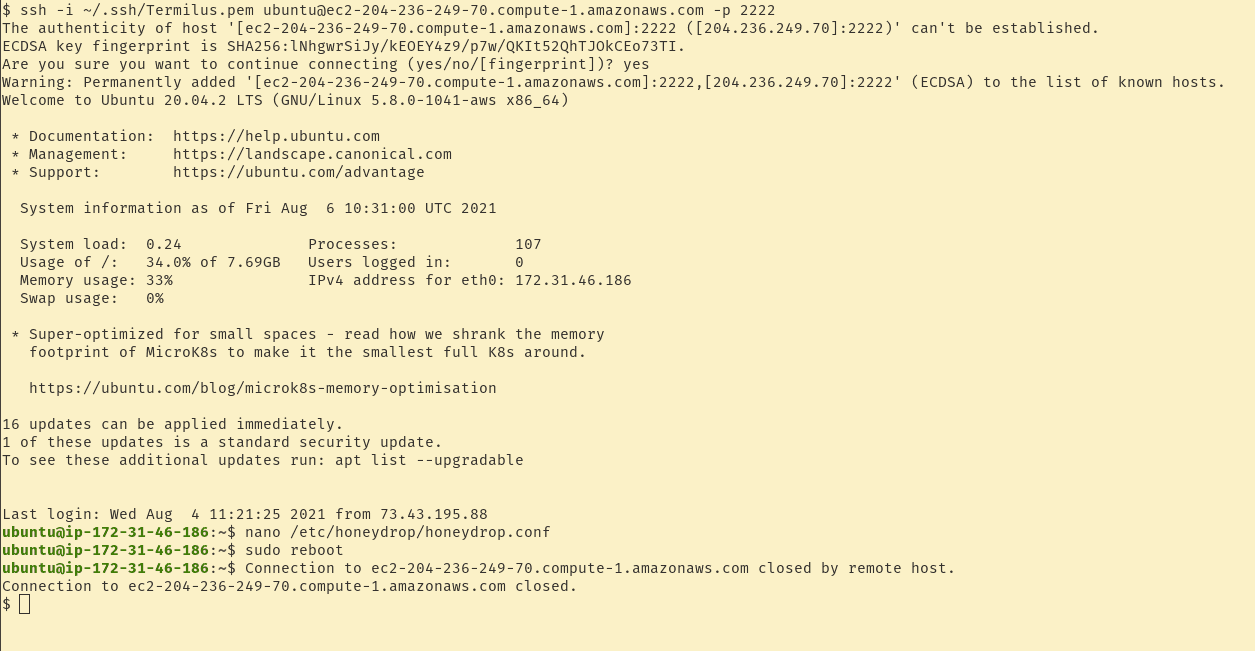
- Now, SSH into the HoneyDrop appliance:
ssh -i <private key> ubuntu@<IP address> -p 2222 -
Update the honeydrop.config file:
nano /etc/honeydrop/honeydrop.conf-
To emulate a Windows SQL server, change the following services to true:
- smb.enabled
- mssql.enabled
-
To emulate a Windows web server, change the following services to true:
- smb.enabled
- http.enabled
- httpproxy.enabled
-
To emulate a Linux MySQL server, change the following services to true:
- mysql.enabled
- ssh.enabled
- vnc.enabled
-
To emulate a Linux web server, change the following services to true:
- ftp.enabled
- http.enabled
- ssh.enabled
- vnc.enabled
- telnet.enabled
-
- Finish editing the HoneyDrop configuration file, save it and reboot the appliance.
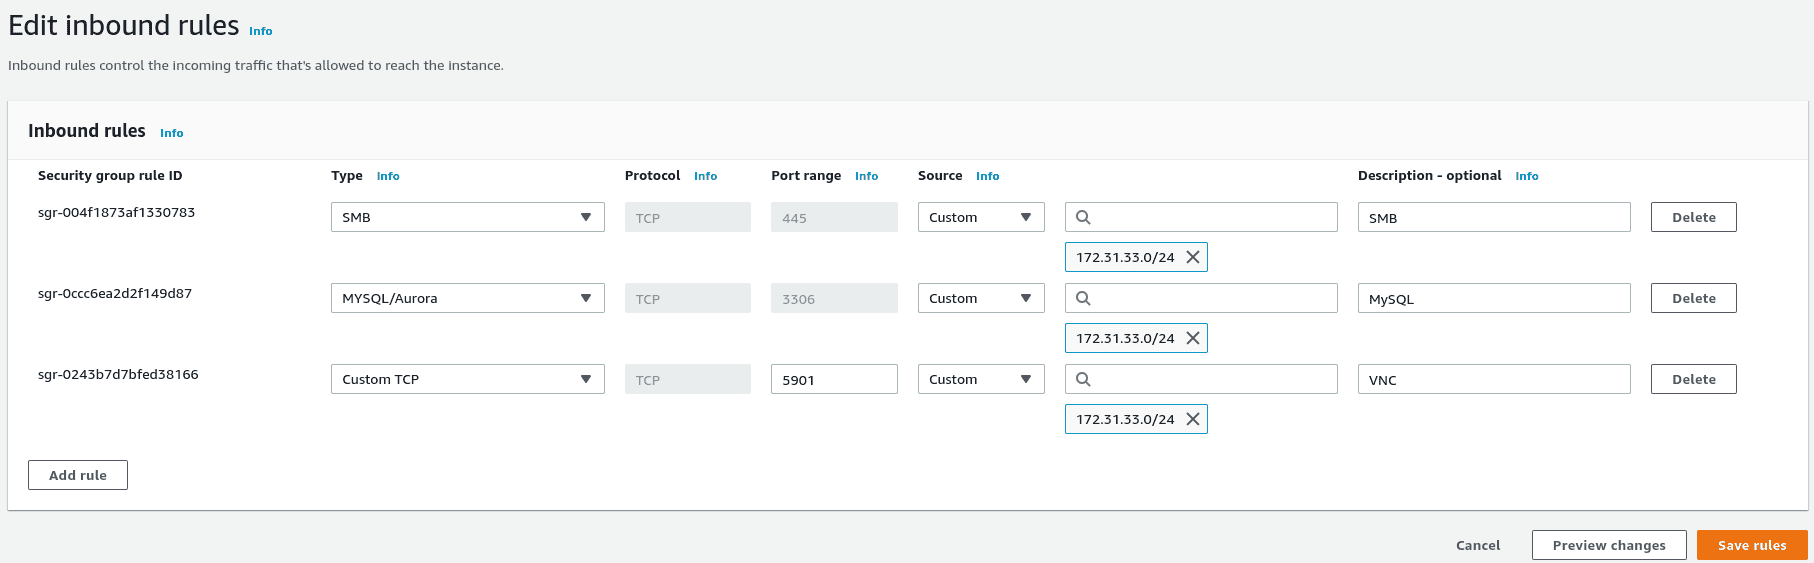
- Edit the security group of the HoneyDrop appliance to only allow honeypot ports to be exposed: https://console.aws.amazon.com/ec2/v2/home#SecurityGroups:
In the example below, we've setup a Linux MySQL honeypot and are allowing connections to SSH, VNC, and MySQL:
And that's it! Your appliance should now be up and running in your environment. Test the services you enabled by interacting with them and see the alerts appear in AWS CloudWatch.
Video
Setting Up Alarms
Now that your HoneyDrop appliance is set up and configured, it's time to configure some alerts.
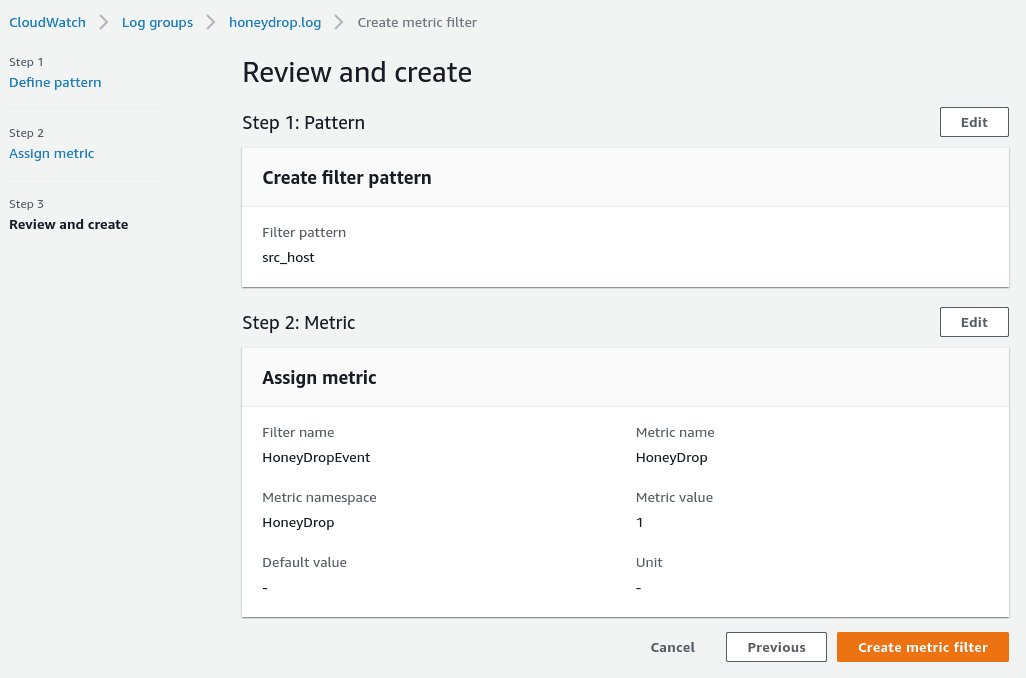
First, let's configure the metric filter within CloudWatch Logs. This is necessary to identify events triggered by the HoneyDrop appliance. AWS does a great job explaining the setup here, but for the sake of simplicity, navigate here and click on "Create Metric Filter".
Here we will set the filter pattern to "src_host". This means that any time an event is recorded, the metric filter will be triggered since all HoneyDrop events capture the source host field in their logs. Set the additional parameters according to the image below.
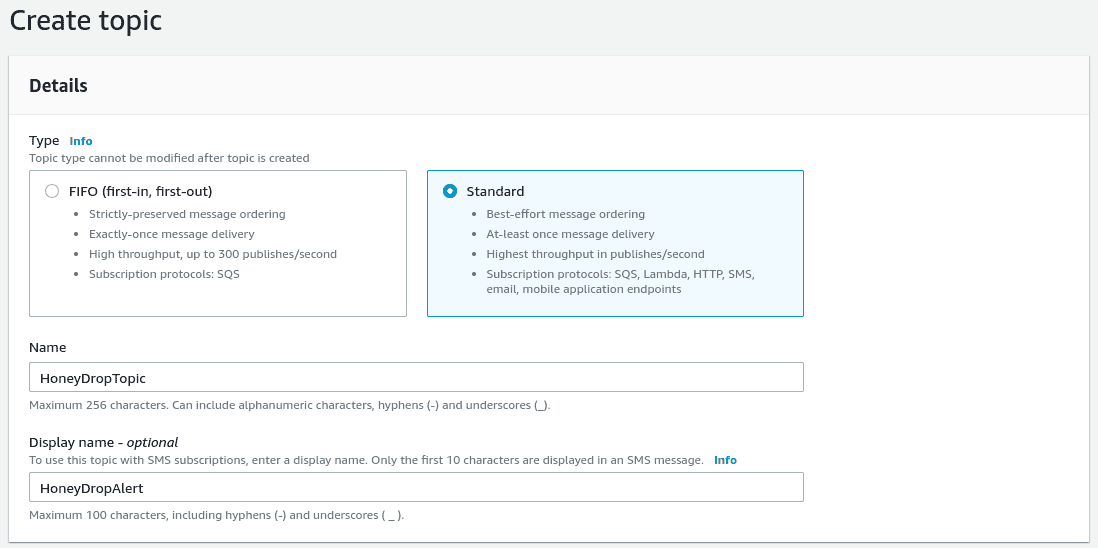
Next, we need to setup our SNS topic. This is the mechanism that will send an email out whenever the HoneyDrop catches an attacker. We'll start by navigating to AWS Simple Notification Service (SNS) and clicking on "Topics", or just click here. Now, click on "Create topic". Enter the details according to the following image.
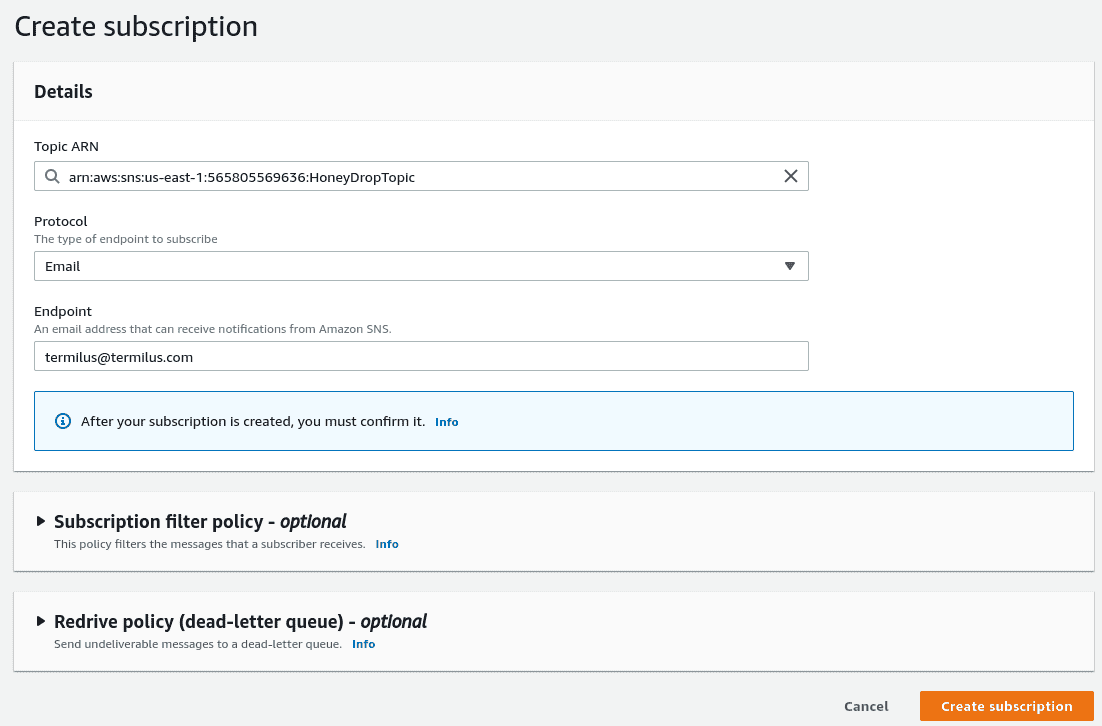
Now we need to subscribe to our topic by clicking on "Create subscription". Set the "Protocol" to email and the "Endpoint" to your email address then click "Create subscription".
Don't forget to check your email and click "Confirm subscription".
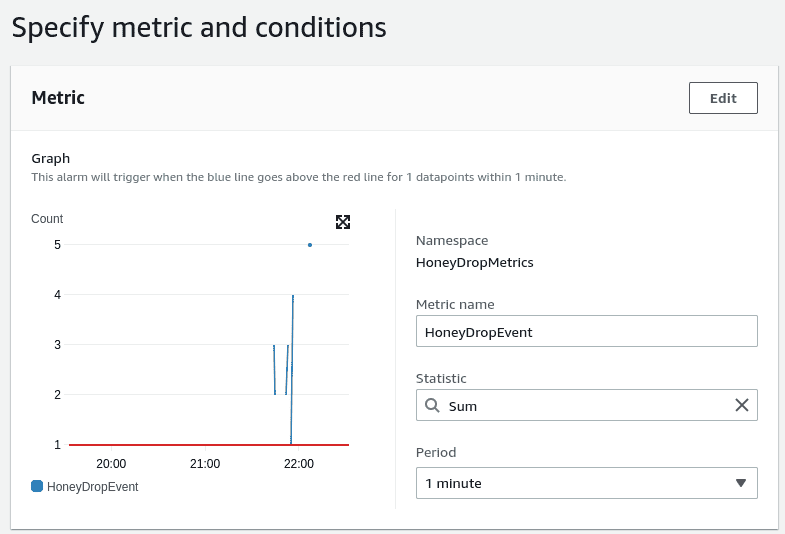
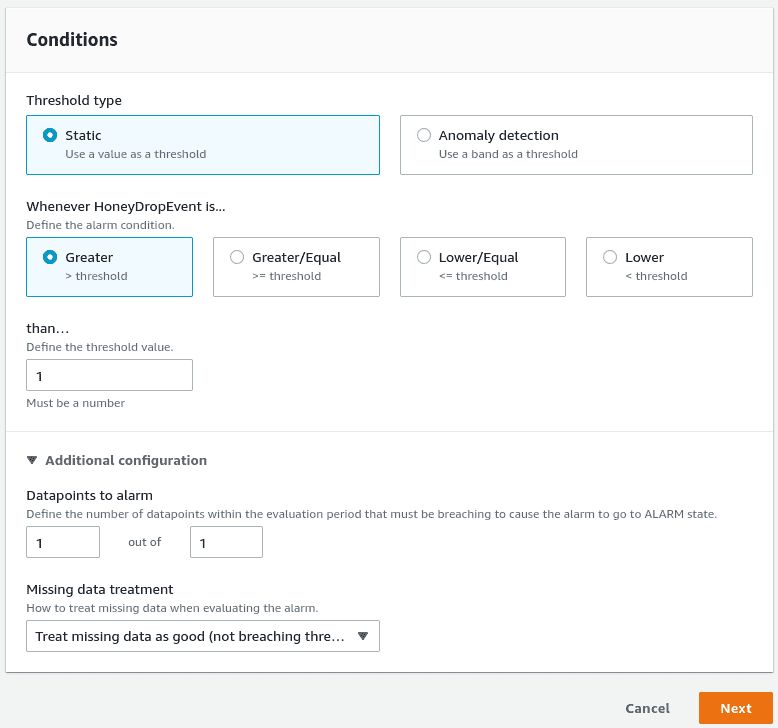
Next, we'll configure a CloudWatch alarm. Navigate to the the "All alarms" pane in CloudWatch, here and click "Create alarm" and then "Select metric". Here, we'll select "HoneyDropMetrics", then "Metrics with no dimensions", then check "HoneyDropEvent" and click "Select metric". Now, enter the metric and condition details according to the following images and click "Next".
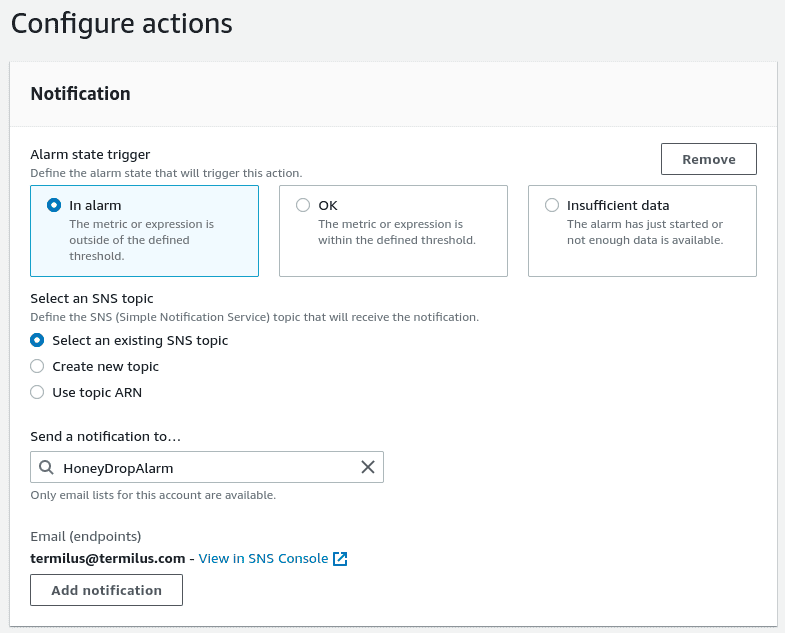
Now, we'll configure the alarm to send our SNS notification whenever it's triggered. Once our SNS topic is selected, we can hit "Next".
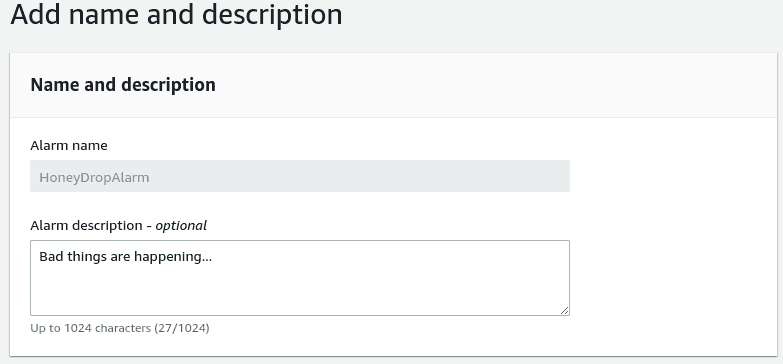
Here, we enter our alarm name and description and hit "next".
Finally, we can review our alarm and hit "Create alarm".
That's it. Now, whenever our HoneyDrop appliance lures in an attacker, its services will capture the interaction and trigger an SNS email notification - alerting you that bad things are happening.
Troubleshooting
-
Not seeing alerts in CloudWatch Logs?
- Check to make sure the HoneyDrop is in a subnet where other hosts can reach it and that security group permits inbound connections on enabled services.
- Ensure the role attached to the HoneyDrop appliance has the CloudWatchAgentServerPolicy policy attached to it.
- Attempt authenticating to one of the enabled services to generate some logs.
FAQ
- Does the HoneyDrop appliance support single-AZ, multi-AZ or multi-region deployments? The appliance is a single EC2 instance that can be deployed into any VPC in any region.
- Does the HoneyDrop appliance support all regions? Yes, all regions are supported.
- Should we use the root user for deploying the HoneyDrop appliance? No, it is recommended to use a non-root user to deploy the appliance.
- Should the HoneyDrop appliance be encrypted when deployed? Yes, security best-practice is to encrypt the appliance when provisioned.
- Is data in-transit encrypted? Yes, data sent to CloudWatch Logs is encrypted in-transit.
- Which services used by HoneyDrop are billable? The HoneyDrop appliance incurs Cloudwatch, EC2, and software cost when deployed. For example, a t3.medium HoneyDrop instance costs $0.042 per hour plus $0.05 per hour for software for a total of $0.092 per hour of deployment.
- How can I monitor the health of the HoneyDrop appliance? Check the health of your server by viewing its status in the "Instance State" column in the EC2 Dashboard.
- How does the HoneyDrop appliance get patched and updated? The appliance is set to auto-install security patches on a daily basis.
- How do I handle a non-responsive HoneyDrop appliance? This is very rare, but a reboot should resolve the issue.
- Is there technical assistance available to help troubleshoot? Yes, we're available to assist and will typically respond within 1 business day. We can be reached by emailing: support at termilus.com